
If you use a continuous glucose monitor (CGM), you’ve probably seen standard deviation (or SD) pop up on your CGM reports. If you don’t know what standard deviation is, it can feel like one more confusing statistic.
Let’s dive into what standard deviation actually means so you can use it to make smarter, simpler changes to your day-to-day diabetes management.
Please note, this post is not medical advice. Make sure to consult with your healthcare team before making any changes to your diabetes management routine. This post is not sponsored, however some of the links below may contain affiliate links. This means that if you click on a link and purchase a product, I may get a small commission at no cost to you.
What is Standard Deviation?
Standard deviation is reported in the same units as your blood sugar (mg/dL or mmol/L), and in short, measures glucose variability.
In simpler terms, standard deviation is a way to measure how much your glucose readings “bounce around” relative to your average blood sugar. If your readings are tightly clustered near your average, your standard deviation will be lower. If they swing widely up or down, your standard deviation will be higher.
Why Does SD Matter?
Variability matters because two people can have the same average blood sugar or A1C, but very different day-to-day experiences. One person with lots of swings (high standard deviation) might experience frequent lows or post-meal spikes, even though their average looks fine on paper. This can lead to more complications down the road.
Another person with the same average but lower standard deviation may have steadier blood sugars and be at lower risk for unpredictable lows and post-meal spikes. Standard deviation helps reveal how stable that average actually is.
Standard deviation (SD) Vs. Coefficient of Variation (CV)
Standard deviation is useful, but it doesn’t tell the whole story. An SD of 50 mg/dL carries different significance for someone with a mean blood sugar of 120 mg/dL than for someone with a mean blood sugar of 200 mg/dL.
To account for that, clinicians often use the coefficient of variation (CV), which normalizes SD by dividing it by the mean glucose and converting to a percentage: CV = (SD / mean glucose) × 100.
The international consensus recommends a target CV of ≤36% because it predicts a lower risk of hypoglycemia and provides a better sense of true variability across different averages.
So it is best to use SD to understand blood sugar swings, and CV to compare variability across time or between people.
A quick example:
Mean glucose = 150 mg/dL, SD = 45 mg/dL.
CV = (45 / 150) × 100 = 30%
That CV of 30% would be considered within the recommended target (≤36%). If your mean glucose were 100 mg/dL with the same SD of 45 mg/dL, your CV would be 45%, meaning much higher relative variability and a greater likelihood of problematic lows or swings.
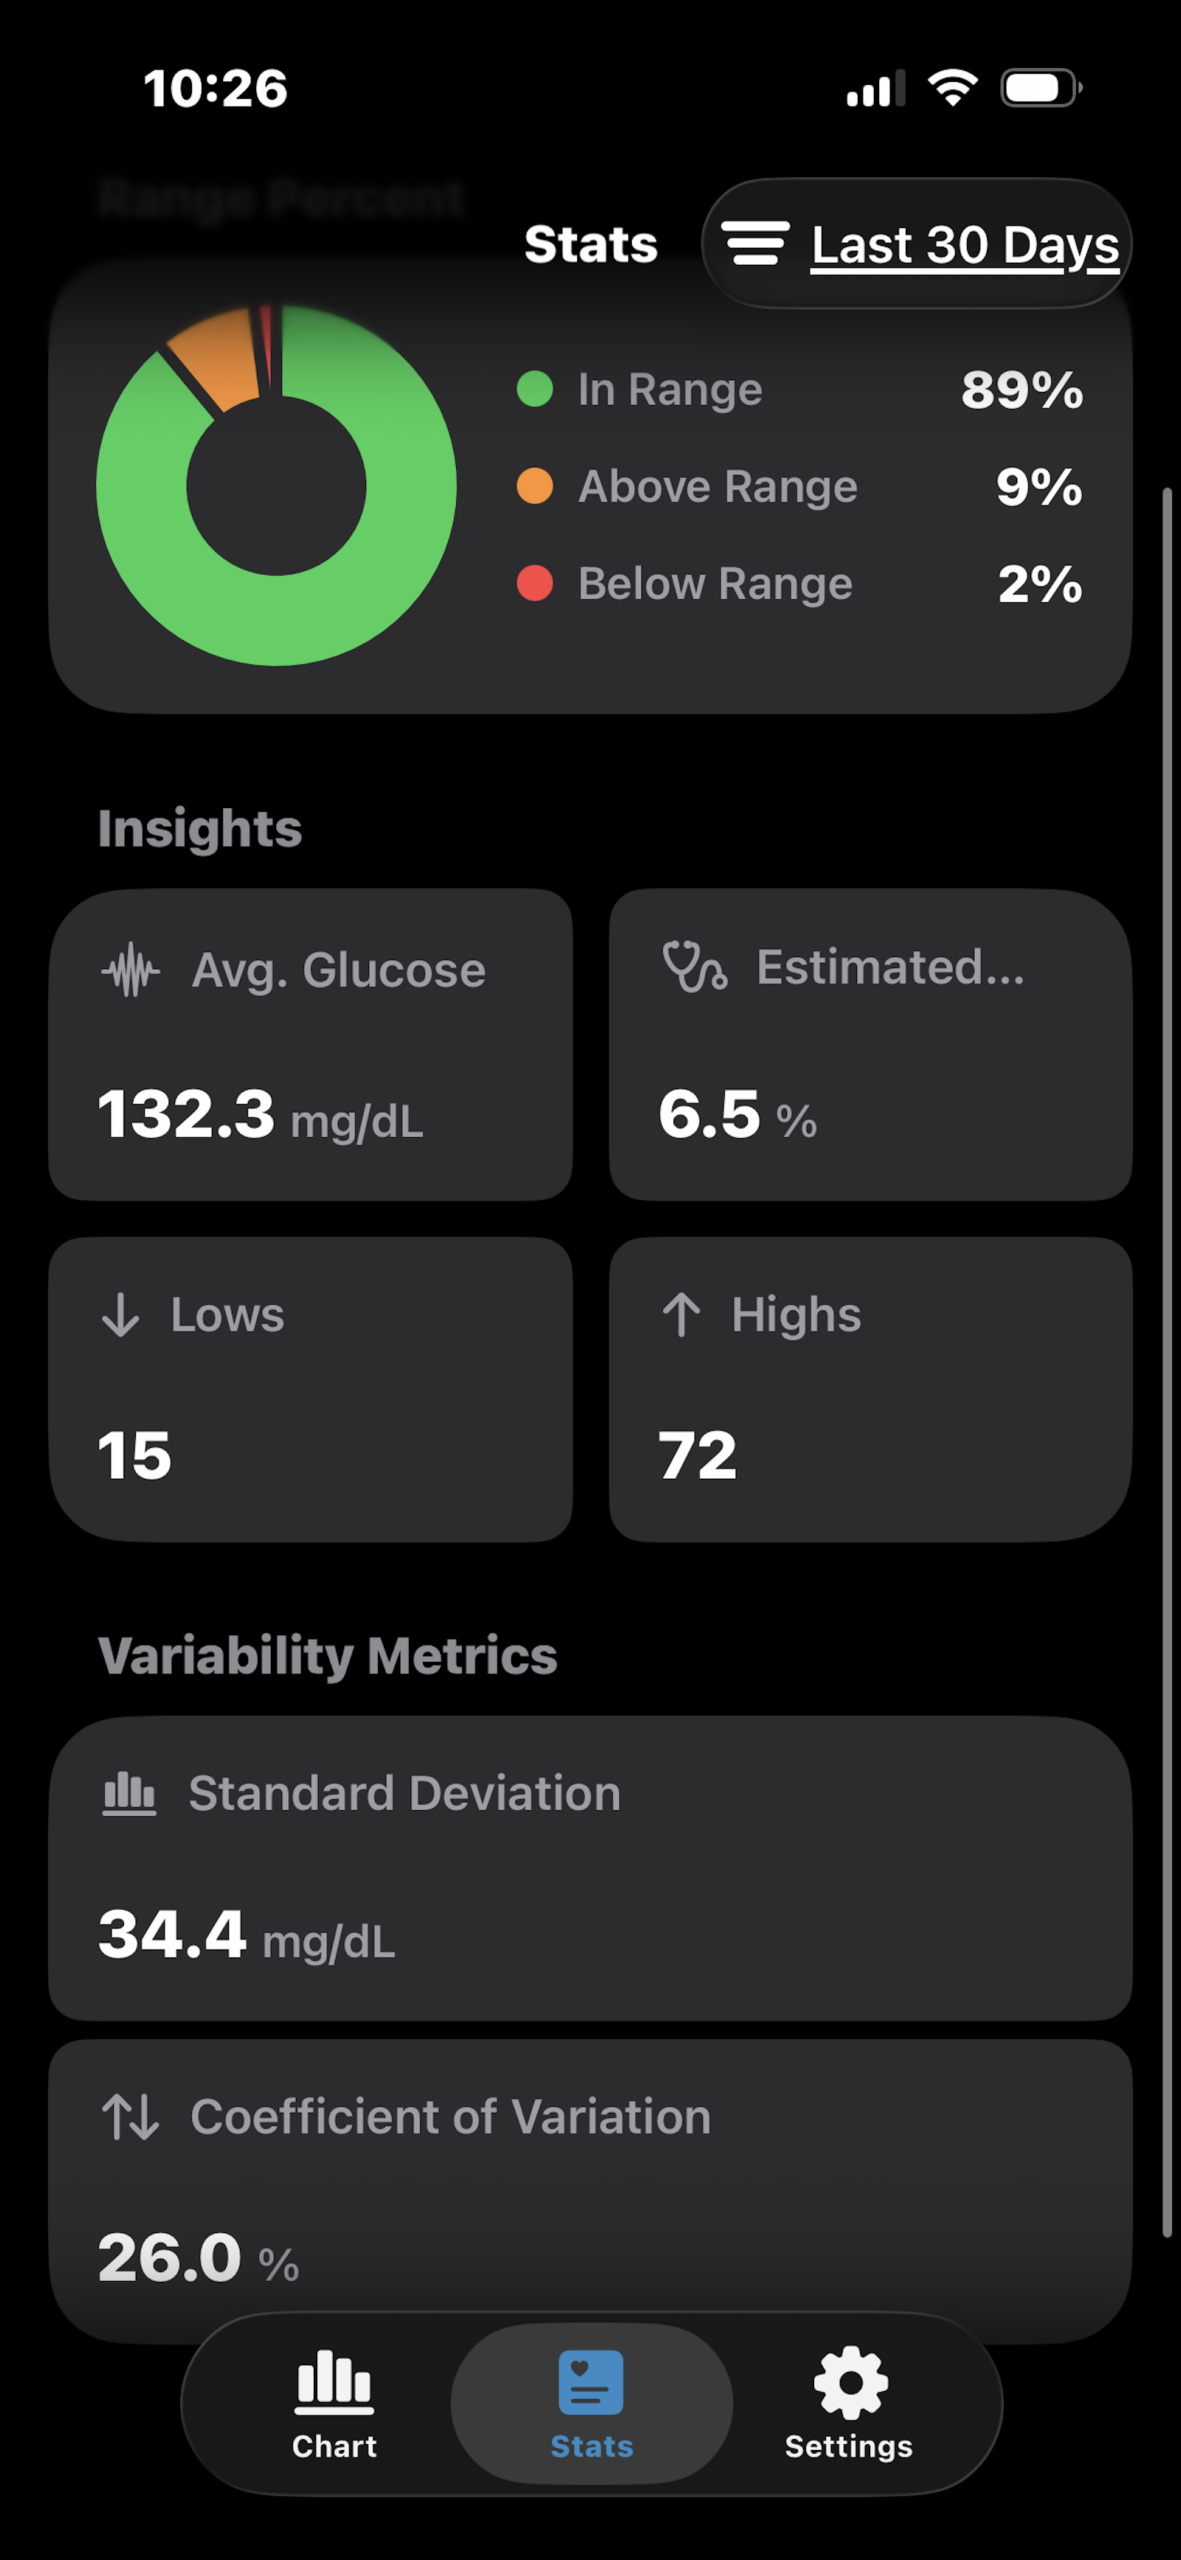
How SD Shows up on CGM Reports
On most CGM reports, SD is listed alongside average glucose, time in range, time below range/time above range, and CV. The Ambulatory Glucose Profile (AGP) one-page summary also uses visual cues including the median (dark line), the 25–75% interquartile band (IQR), and 10–90% shaded ranges, to show how tightly glucose values cluster at each time of day.
If those shaded bands are wide (especially at certain times, like after meals or overnight), that matches a higher SD and tells you when variability happens.
Generating an AGP with sufficient data (typically 10–14 days with ≥70% data capture) makes these numbers and patterns reliable.
What SD Cannot Tell You?
SD tells you about the spread of blood sugars, not the direction. It won’t tell you whether swings are mostly highs or lows, or the timing of those swings. That’s why SD should be used with time-in-range metrics and the AGP visual to find when issues occur.
For example, if your SD is high and the IQR is wide from 2–6 p.m., maybe post-lunch spikes are the issue.
Steps to Improve Your Standard Deviation
The following tips will help you use your data to improve your SD:
- Look for timing: Open your AGP report and look at when the IQR/90th-percentile bands widen, indicating greater variability. Is it after meals, overnight, or with exercise? Target those windows first.
- Tackle predictable spikes: Adding pre-boluses before meals, adjusting insulin-to-carb ratios at specific meals, or changing the types and amounts of carbohydrate you eat can help reduce post-meal swings. Work with your diabetes care team before changing doses.
- Reduce lows and rebound highs: If you see frequent lows followed by rebound highs, focus on avoiding overtreatment of lows. You may also want to evaluate basal rates and sensitivity settings.
- Increase consistency: Regular meal timing, predictable carb intake, and consistent activity patterns can help reduce variability.
- Use technology: Some CGM apps and platforms flag recurring patterns and suggest changes.
- Review your data: Spend 5–10 minutes each week with your CGM summary. Check mean glucose, SD, and CV, and what changes you are noticing over time.
- Make changes: Pick one small change to test for a few days (timing insulin, swapping a snack, changing bedtime routine, etc). Make sure to take notes and iterate!
Final Thoughts
Standard deviation is a simple, powerful number once you understand what it measures: the size of your glucose swings. Paired with CV, Time in Range, and the AGP report, SD helps you move from “my A1c looks okay” to a clearer reality, “my A1C looks okay AND my blood sugars are steady.” That shift is what makes day-to-day diabetes management less stressful and more predictable.
As the basal/bolus coach at FTF Warrior, I work privately with clients in the FTF Warrior Program to test and tune basal rates, insulin-to-carb ratios, correction factors, and more so you can build a consistent foundation and have better blood sugar control and predictability. If you’re ready to stop guessing and start truly understanding your numbers, book a free discovery call to learn more.